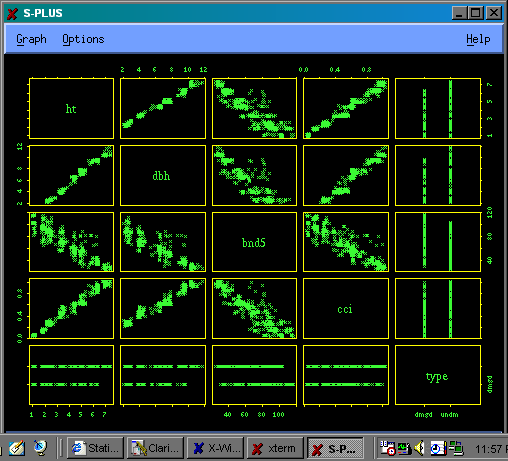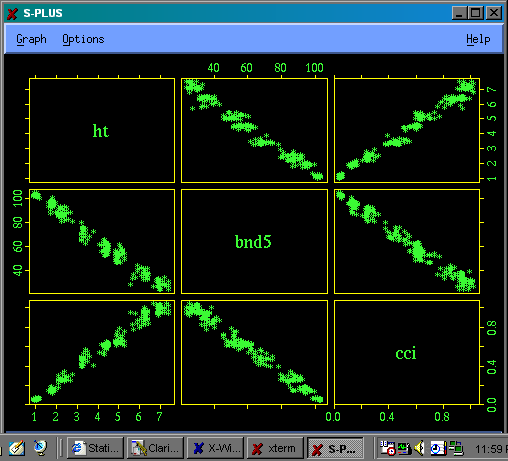
Here is an exercise to get you started at statistical computing. See what you can do using SPSS or Minitab. Next week you can try the Splus code when we meet in the Windows lab. The Splus code and the resulting graphs are shown below. This is a class exercise, not an assignment to be handed in.
Click here to get the trees data we discussed in class. The cases are stands of trees; the variables are: mean height (ht); mean diameter at breast height (dbh); Band 5 from a satellite observation (bnd5); crown cover index (cci); and type of stand (damaged by roads, storms, or whatever, or undamaged). This file has the corrected dbh measurements. Save the page from your web browser as a text file called trees.txt, then import it into a statistics package such as SPSS or Minitab and plot the scatterplot matrices. When you look for the command for scatterplot matrix, be warned that different packages call it different names.
Begin by using ftp or Copy/Paste to transfer trees.txt from your PC to stats, then launch Splus.
S-PLUS : Copyright (c) 1988, 1998 MathSoft, Inc.
S : Copyright Lucent Technologies, Inc.
Version 5.0 Release 1 for Sun SPARC, SunOS 5.5 : 1998
Working data will be in .
Open a graphics window.
> motif()
Read the file trees.txt into a data frame called trees; take variable names from the header (the first row).
> trees <- read.table("trees.txt", header=T)
Display the first 10 rows and all the columns of the data frame to see what is there. This data frame is an S object that includes the data matrix (cases in rows, variables in columns) together with the names of the rows and the names of the columns. Because I didn't give row names, the row names are just the row numbers.
> trees[1:10,]
     ht dbh bnd5        cci      type
 1 1.00  NA  102 0.04146902 undamaged
 2 1.21  NA   99 0.05835823 undamaged
 3 1.21  NA   99 0.06029240 undamaged
 4 1.18  NA  102 0.06414085 undamaged
 5 1.03  NA  103 0.04427970 undamaged
 6 1.06  NA  104 0.05017752 undamaged
 7 1.09  NA  103 0.03997755 undamaged
 8 1.07  NA  102 0.04429646 undamaged
 9 1.16  NA  102 0.04227327 undamaged
10 1.07  NA  104 0.05466371 undamaged
Plot a scatterplot matrix using all the columns. Note that there are missing values in the dbh column; are missing values handled listwise or pairwise in these plots? Check this for each package you try; if the documentation doesn't say, run some simple examples to find out.
> pairs(trees)

Plot a scatterplot matrix for the undamaged stands, using only variables ht, bnd5 and cci. The variable type within the data frame trees is referenced as trees$type. The combine function c(1,3,4) is used here to express the selected column indices as a single object.
> pairs(trees[trees$type=="undamaged",c(1,3,4)])

Quit Splus.
> q()