Classification Trees in R
2002-04-06, updated 2007-01-17
> library(tree)

> treedata
   obj A B C D E
1    1 y n y n y
2    1 n n y n y
3    1 y n y y y
4    1 n y n n n
5    1 y y n y n
6    1 n n y n y
7    1 n n n n n
8    1 n n n n n
9    0 n n n n y
10   0 y y n n y
11   0 n n y y y
12   0 y y y y n
13   0 n y n y n
14   0 n n n n y
15   0 n n n n y
16   0 n y n n y
17   0 n n n n y
18   0 n y n n y
19   0 n y n n y
20   0 n n n n y

> tree2 <- tree(as.factor(obj)~A+B+C+D+E,data=treedata,
control=tree.control(nobs=20,minsize=5))

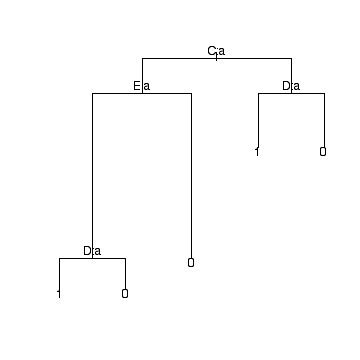
> tree2
node), split, n, deviance, yval, (yprob)
      * denotes terminal node

1) root 20 26.920 0 ( 0.6000 0.4000 )
  2) C: n 14 16.750 0 ( 0.7143 0.2857 )
    4) E: n 5  5.004 1 ( 0.2000 0.8000 )
      8) D: n 3  0.000 1 ( 0.0000 1.0000 ) *
      9) D: y 2  2.773 0 ( 0.5000 0.5000 ) *
    5) E: y 9  0.000 0 ( 1.0000 0.0000 ) *
  3) C: y 6  7.638 1 ( 0.3333 0.6667 )
    6) D: n 3  0.000 1 ( 0.0000 1.0000 ) *
    7) D: y 3  3.819 0 ( 0.6667 0.3333 ) *

> summary(tree2)

Classification tree:
tree(formula = as.factor(obj) ~ A + B + C + D + E, data = treedata,
    control = tree.control(nobs = 20, minsize = 5))
Variables actually used in tree construction:
[1] "C" "E" "D"
Number of terminal nodes:  5
Residual mean deviance:  0.4394 = 6.592 / 15
Misclassification error rate: 0.1 = 2 / 20

> plot(tree2)
> text(tree2)

> tree3 <- tree(obj~A+B+C+D+E,data=treedata,
control=tree.control(nobs=20,minsize=5))
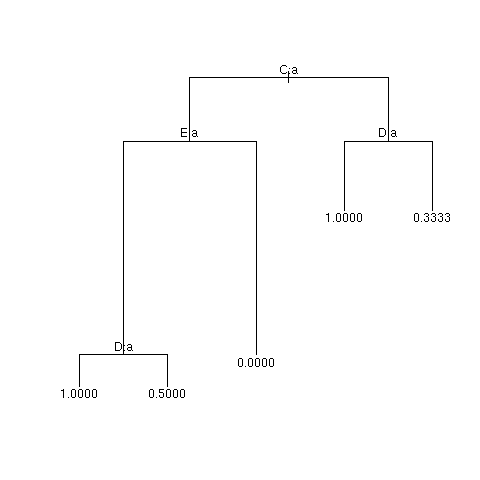
> tree3
node), split, n, deviance, yval
      * denotes terminal node

1) root 20 4.8000 0.4000
  2) C: n 14 2.8570 0.2857
    4) E: n 5 0.8000 0.8000
      8) D: n 3 0.0000 1.0000 *
      9) D: y 2 0.5000 0.5000 *
    5) E: y 9 0.0000 0.0000 *
  3) C: y 6 1.3330 0.6667
    6) D: n 3 0.0000 1.0000 *
    7) D: y 3 0.6667 0.3333 *

> summary(tree3)

Regression tree:
tree(formula = obj ~ A + B + C + D + E, data = treedata,
    control = tree.control(nobs = 20, minsize = 5))
Variables actually used in tree construction:
[1] "C" "E" "D"
Number of terminal nodes:  5
Residual mean deviance:  0.07778 = 1.167 / 15
Distribution of residuals:
      Min.    1st Qu.     Median       Mean    3rd Qu.       Max.
-5.000e-01  0.000e+00  0.000e+00  5.551e-18  0.000e+00  6.667e-01

> plot(tree3)
> text(tree3)
