Examples in R
Class Notes from 2002-01-08
R: Copyright 2001, The R Development Core Team
Version 1.4.0  (2001-12-19)

R is free software and comes with ABSOLUTELY NO WARRANTY.
You are welcome to redistribute it under certain conditions.
Type `license()' or `licence()' for distribution details.

R is a collaborative project with many contributors.
Type `contributors()' for more information.

Type `demo()' for some demos, `help()' for on-line help, or
`help.start()' for a HTML browser interface to help.
Type `q()' to quit R.

> mydata <- data.frame(y=c(1.2,3.6,5.1,4.2,2.1),
+ x1=c(1.5,2.5,6.3,3.1,2.2), x2=factor(c(1,1,1,2,2)))
> mydata
    y  x1 x2
1 1.2 1.5  1
2 3.6 2.5  1
3 5.1 6.3  1
4 4.2 3.1  2
5 2.1 2.2  2
> mydata$y
[1] 1.2 3.6 5.1 4.2 2.1
> dimnames(mydata)
[[1]]
[1] "1" "2" "3" "4" "5"

[[2]]
[1] "y"  "x1" "x2"

> dimnames(mydata)[[2]]
[1] "y"  "x1" "x2"
> mean(mydata$y)
[1] 3.24
> var(mydata$y)
[1] 2.493
> sqrt(mydata$y)
[1] 1.095445 1.897367 2.258318 2.049390 1.449138
> sqrt(var(mydata$y))
[1] 1.578924
> mydata[1,4]
Error in "names<-.default"(*tmp*, value = cols) :
	names attribute must be the same length as the vector
> mydata[4,1]
[1] 4.2
> mydata[,1:2]
    y  x1
1 1.2 1.5
2 3.6 2.5
3 5.1 6.3
4 4.2 3.1
5 2.1 2.2
> mydata[,-3]
    y  x1
1 1.2 1.5
2 3.6 2.5
3 5.1 6.3
4 4.2 3.1
5 2.1 2.2
> apply(mydata[,-3],2,mean)
   y   x1
3.24 3.12
> apply(mydata[,-3],2,var)
    y    x1
2.493 3.492
> sqrt(apply(mydata[,-3],2,var))
       y       x1
1.578924 1.868689
> var(mydata[,-3])
        y     x1
y  2.4930 2.5065
x1 2.5065 3.4920
> cor(mydata[,-3])
           y        x1
y  1.0000000 0.8495119
x1 0.8495119 1.0000000

> macintosh(h=4,w=4)
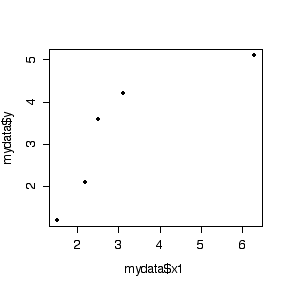
> plot(mydata$x1,mydata$y,pch=19)

> fit1 <- lm(y~x1, data=mydata)
> save.image()
> savehistory()
> ls()
[1] "fit1"   "mydata"
> fit1

Call:
lm(formula = y ~ x1, data = mydata)

Coefficients:
(Intercept)           x1
     1.0005       0.7178

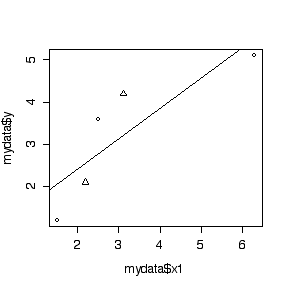
> plot(mydata$x1,mydata$y,pch=as.numeric(mydata$x2))

> abline(fit1)


> coef(fit1)
(Intercept)          x1
  1.0005155   0.7177835
> predict(fit1)
       1        2        3        4        5
2.077191 2.794974 5.522552 3.225644 2.579639
> summary(fit1)

Call:
lm(formula = y ~ x1, data = mydata)

Residuals:
      1       2       3       4       5
-0.8772  0.8050 -0.4226  0.9744 -0.4796

Coefficients:
            Estimate Std. Error t value Pr(>|t|)
(Intercept)   1.0005     0.9109   1.098   0.3523
x1            0.7178     0.2574   2.789   0.0685 .
---
Signif. codes:  0 `***' 0.001 `**' 0.01 `*' 0.05 `.' 0.1 ` ' 1

Residual standard error: 0.9619 on 3 degrees of freedom
Multiple R-Squared: 0.7217,	Adjusted R-squared: 0.6289
F-statistic: 7.779 on 1 and 3 DF,  p-value: 0.06848
 > fit1 <- lm(y~x1, data=mydata)
> save.image()
> savehistory()
> ls()
[1] "fit1" "mydata"
> fit1
Call:
lm(formula = y ~ x1, data = mydata)
Coefficients:
(Intercept) x1
1.0005 0.7178
> plot(mydata$x1,mydata$y,pch=as.numeric(mydata$x2))
 > abline(fit1)
 > coef(fit1)
(Intercept) x1
1.0005155 0.7177835
> predict(fit1)
1 2 3 4 5
2.077191 2.794974 5.522552 3.225644 2.579639
> summary(fit1)
Call:
lm(formula = y ~ x1, data = mydata)
Residuals:
1 2 3 4 5
-0.8772 0.8050 -0.4226 0.9744 -0.4796
Coefficients:
Estimate Std. Error t value Pr(>|t|)
(Intercept) 1.0005 0.9109 1.098 0.3523
x1 0.7178 0.2574 2.789 0.0685 .
---
Signif. codes: 0 `***' 0.001 `**' 0.01 `*' 0.05 `.' 0.1 ` ' 1
Residual standard error: 0.9619 on 3 degrees of freedom
Multiple R-Squared: 0.7217, Adjusted R-squared: 0.6289
F-statistic: 7.779 on 1 and 3 DF, p-value: 0.06848